Exploring the Limits to Growth with AI
09 June 2020
In collaboration with Raphaël Louyot, Adrien Allorent & Charles Vanwynsberghe.
Disclaimer: the codebase presented here is in development. I talk about it in case somehow wants to study this subject and wants to use the code. In its present states, with the cost functions coded so far, it gives weird results (see discussion below).
Limits to Growth
In the early 1970s, an international group of researchers called the club of Rome was tasked to study the implication of a continued worldwide growth. This led to the edition of The Limits to Growth a book that remains a reference in the current ecological debate. Its conclusions still hold today: the Earth cannot support present rates of economic and population growth much beyond the year 2100, even considering technological improvements.
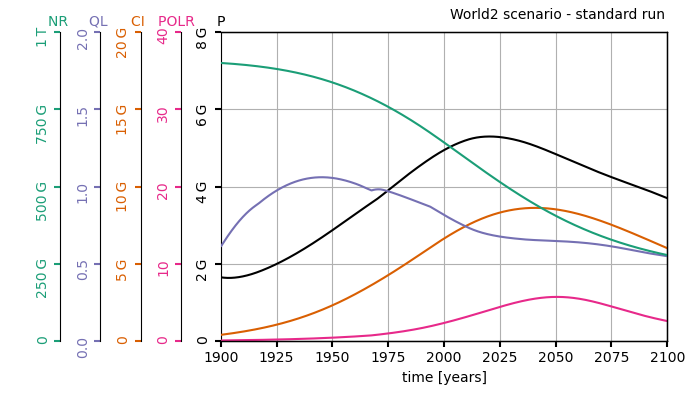
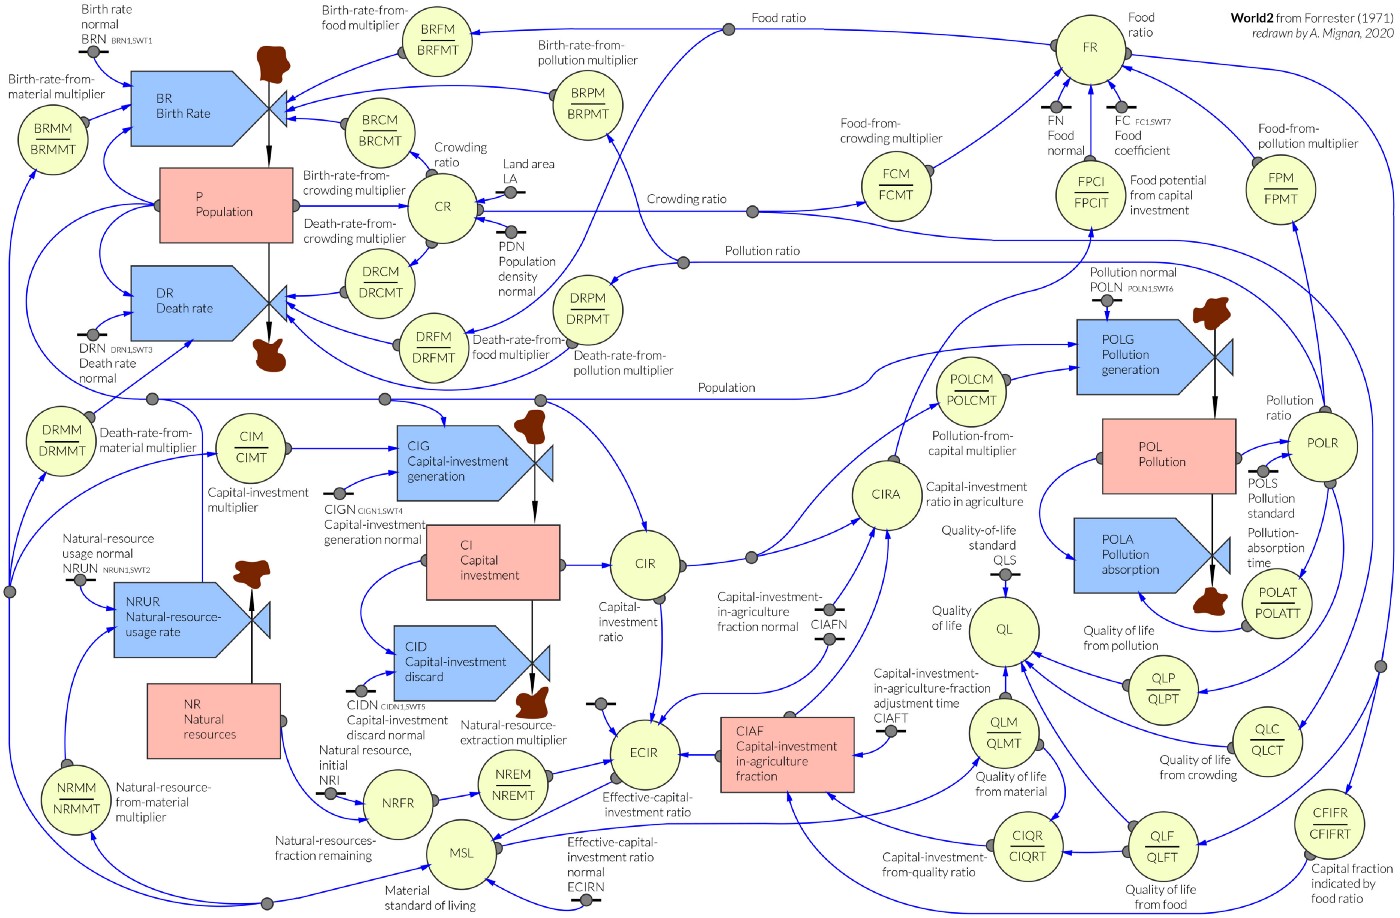
Their conclusions are based on World2 and World3, two dynamical models featuring five basic factors that determine and, in their interactions, ultimately limit growth on this planet—population increase, agricultural production, nonrenewable resource depletion, industrial output, and pollution generation. Fitted on real data, this model predicts the global evolution of these five factors and reaches dark conclusions: a peak of population around 2025 followed by a decrease in population, capital investment and general quality of life (see graph above). Although the model is not predictive per se, it highlights the general tendencies: the continual economic growth and the consumption of natural resources that is tied to it, will lead our modern societies to their end.
In Limits to Growth, the authors investigated 5 scenarios. In each scenario, they modify by hand some of the model’s parameters. What if the stock of natural resources was twice what we think it is? What if we could divide by 2 the amount of pollution emitted per unit of capita? etc. With modern machine learning methods, we can automatize this process, run simulations, and let an optimization algorithm explore the space of mitigation policies to optimize for a given cost function.
Automatic exploration of mitigation strategies
What do we need? First, we need an implementation of the world model. Here, I’ve been working with Charles Vanwynsberghe, who reimplemented World2 and World3 in Python. Read about his quest to make these models more accessible on his blog post. Second, we need an optimization framework. To this end, I’ve adapted EpidemiOptim a framework designed to explore mitigation strategies in the context of epidemics that I presented in this post.
The resulting library is called WorldOptim, an adaptation of EpidemiOptim that incorporates World2, allows to define new optimization problems and to use pre-coded optimization algorithm to solve them. WorldOptim is a general framework from which many questions can be investigated. I haven’t had time to explore them too much, but let’s go over a simple example.
Simple example: maximizing quality of life while minimizing death rates
Now that we have a world model and an optimization framework, we need to define an optimization problem. This means that we need to define cost functions (what we want to optimize) and action modalities (how the mitigation strategy can act on the world).
Here, we’re going to use World2, which is much simpler and has way fewer variables. We decided to use two variables to define cost functions: the quality of life (that should to be maximized) and the death rate (that should stay below a standard value taken as the value in 1970). With a multi-objective optimization algorithm called NSGA-II, we can hope to optimize both of these at once. In terms of action modalities, we stuck to the variables controlled in the original book: the usage of natural resources per person (NRUN), the pollution generation per person (POLN), the capital investment generation per person (CIGN), the birth rate (BRN) and the food coefficient (FC). For each of them, the mitigation policy can either increase of decrease the variable by 5% each year, within limits of 0.2 and 2 times the original values from 1970.
Note that this is a first example of an exploration of mitigation policies and many parameters should be adjusted to make it more realistic and more interesting.
This gives us the following Pareto plot:
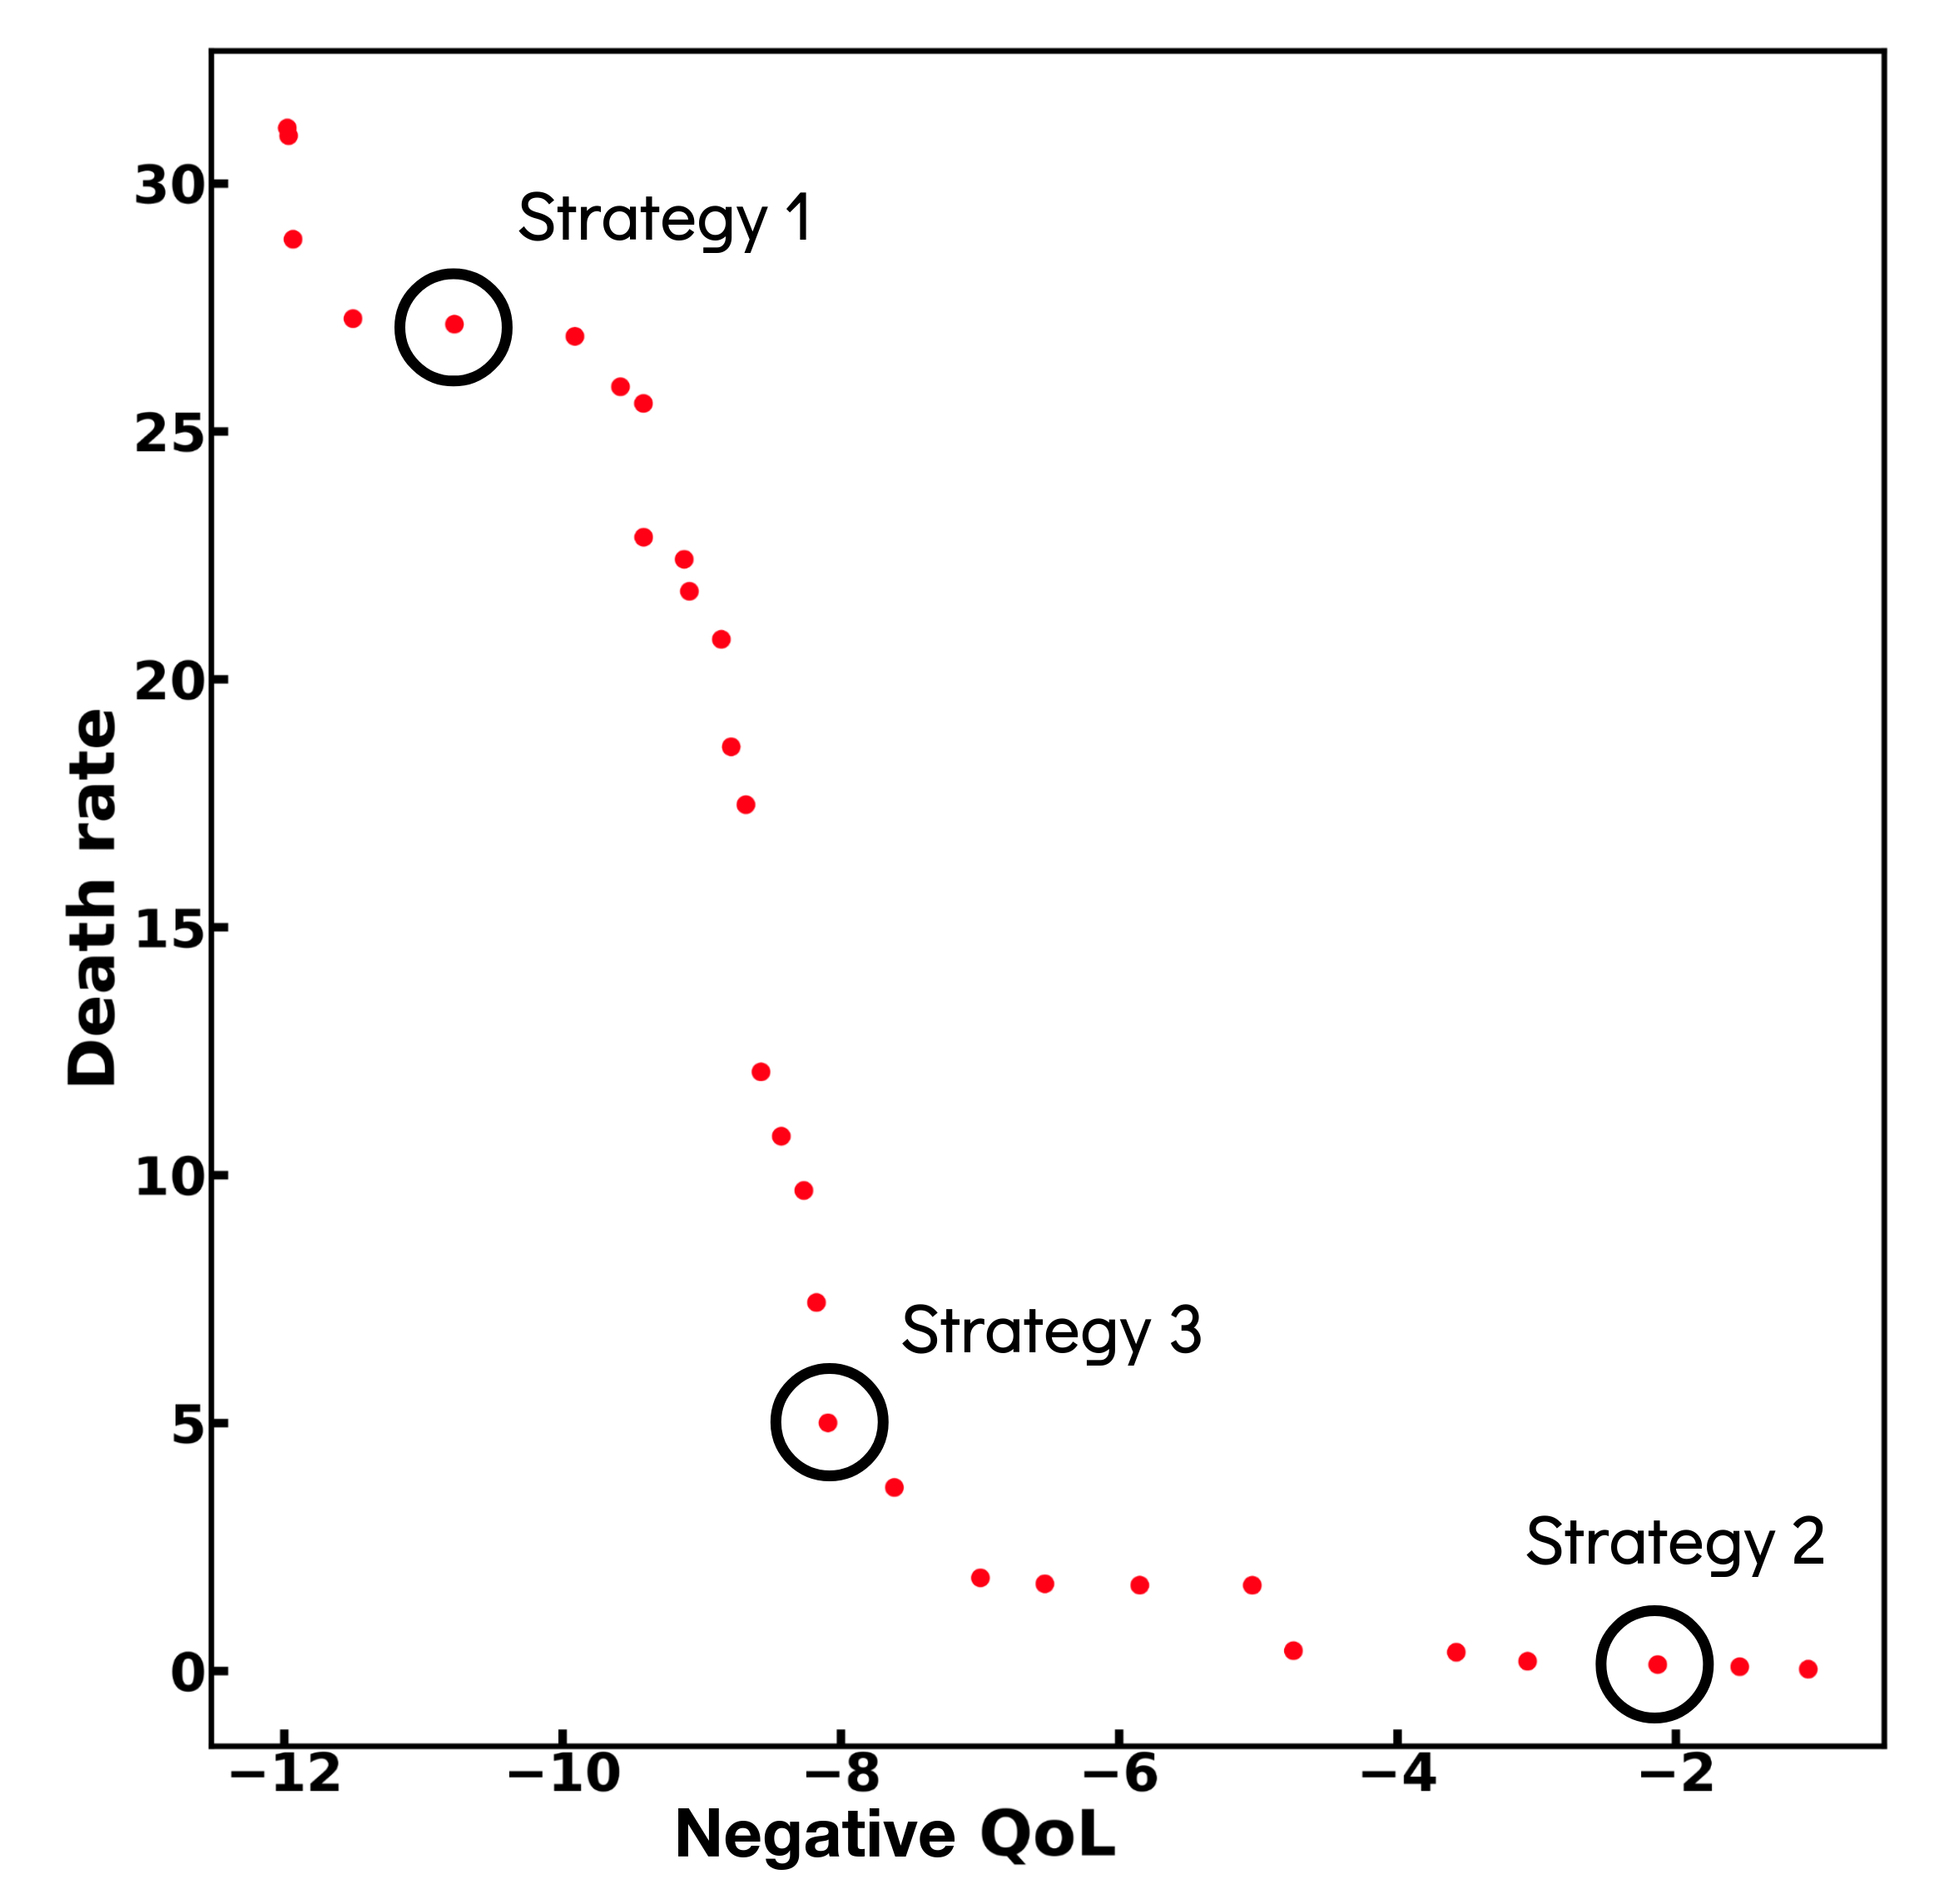
A Pareto plot shows the Pareto front of the optimization process, i.e. the set of solutions for which no solution can be found to be better on both dimensions at once. It shows the all spectrum of compromises that can be made between the two cost functions based on death rates and quality of life. In the top left are the solutions that maximize quality of life but perform poorly in terms of death rates (e.g. Solution 1). In the bottom right corner are the solutions that achieve low death rates but also low quality of life (e.g. Solution 2). In between these corners are various compromises (e.g. Solution 3). Let’s have a closer look.
Solution 1
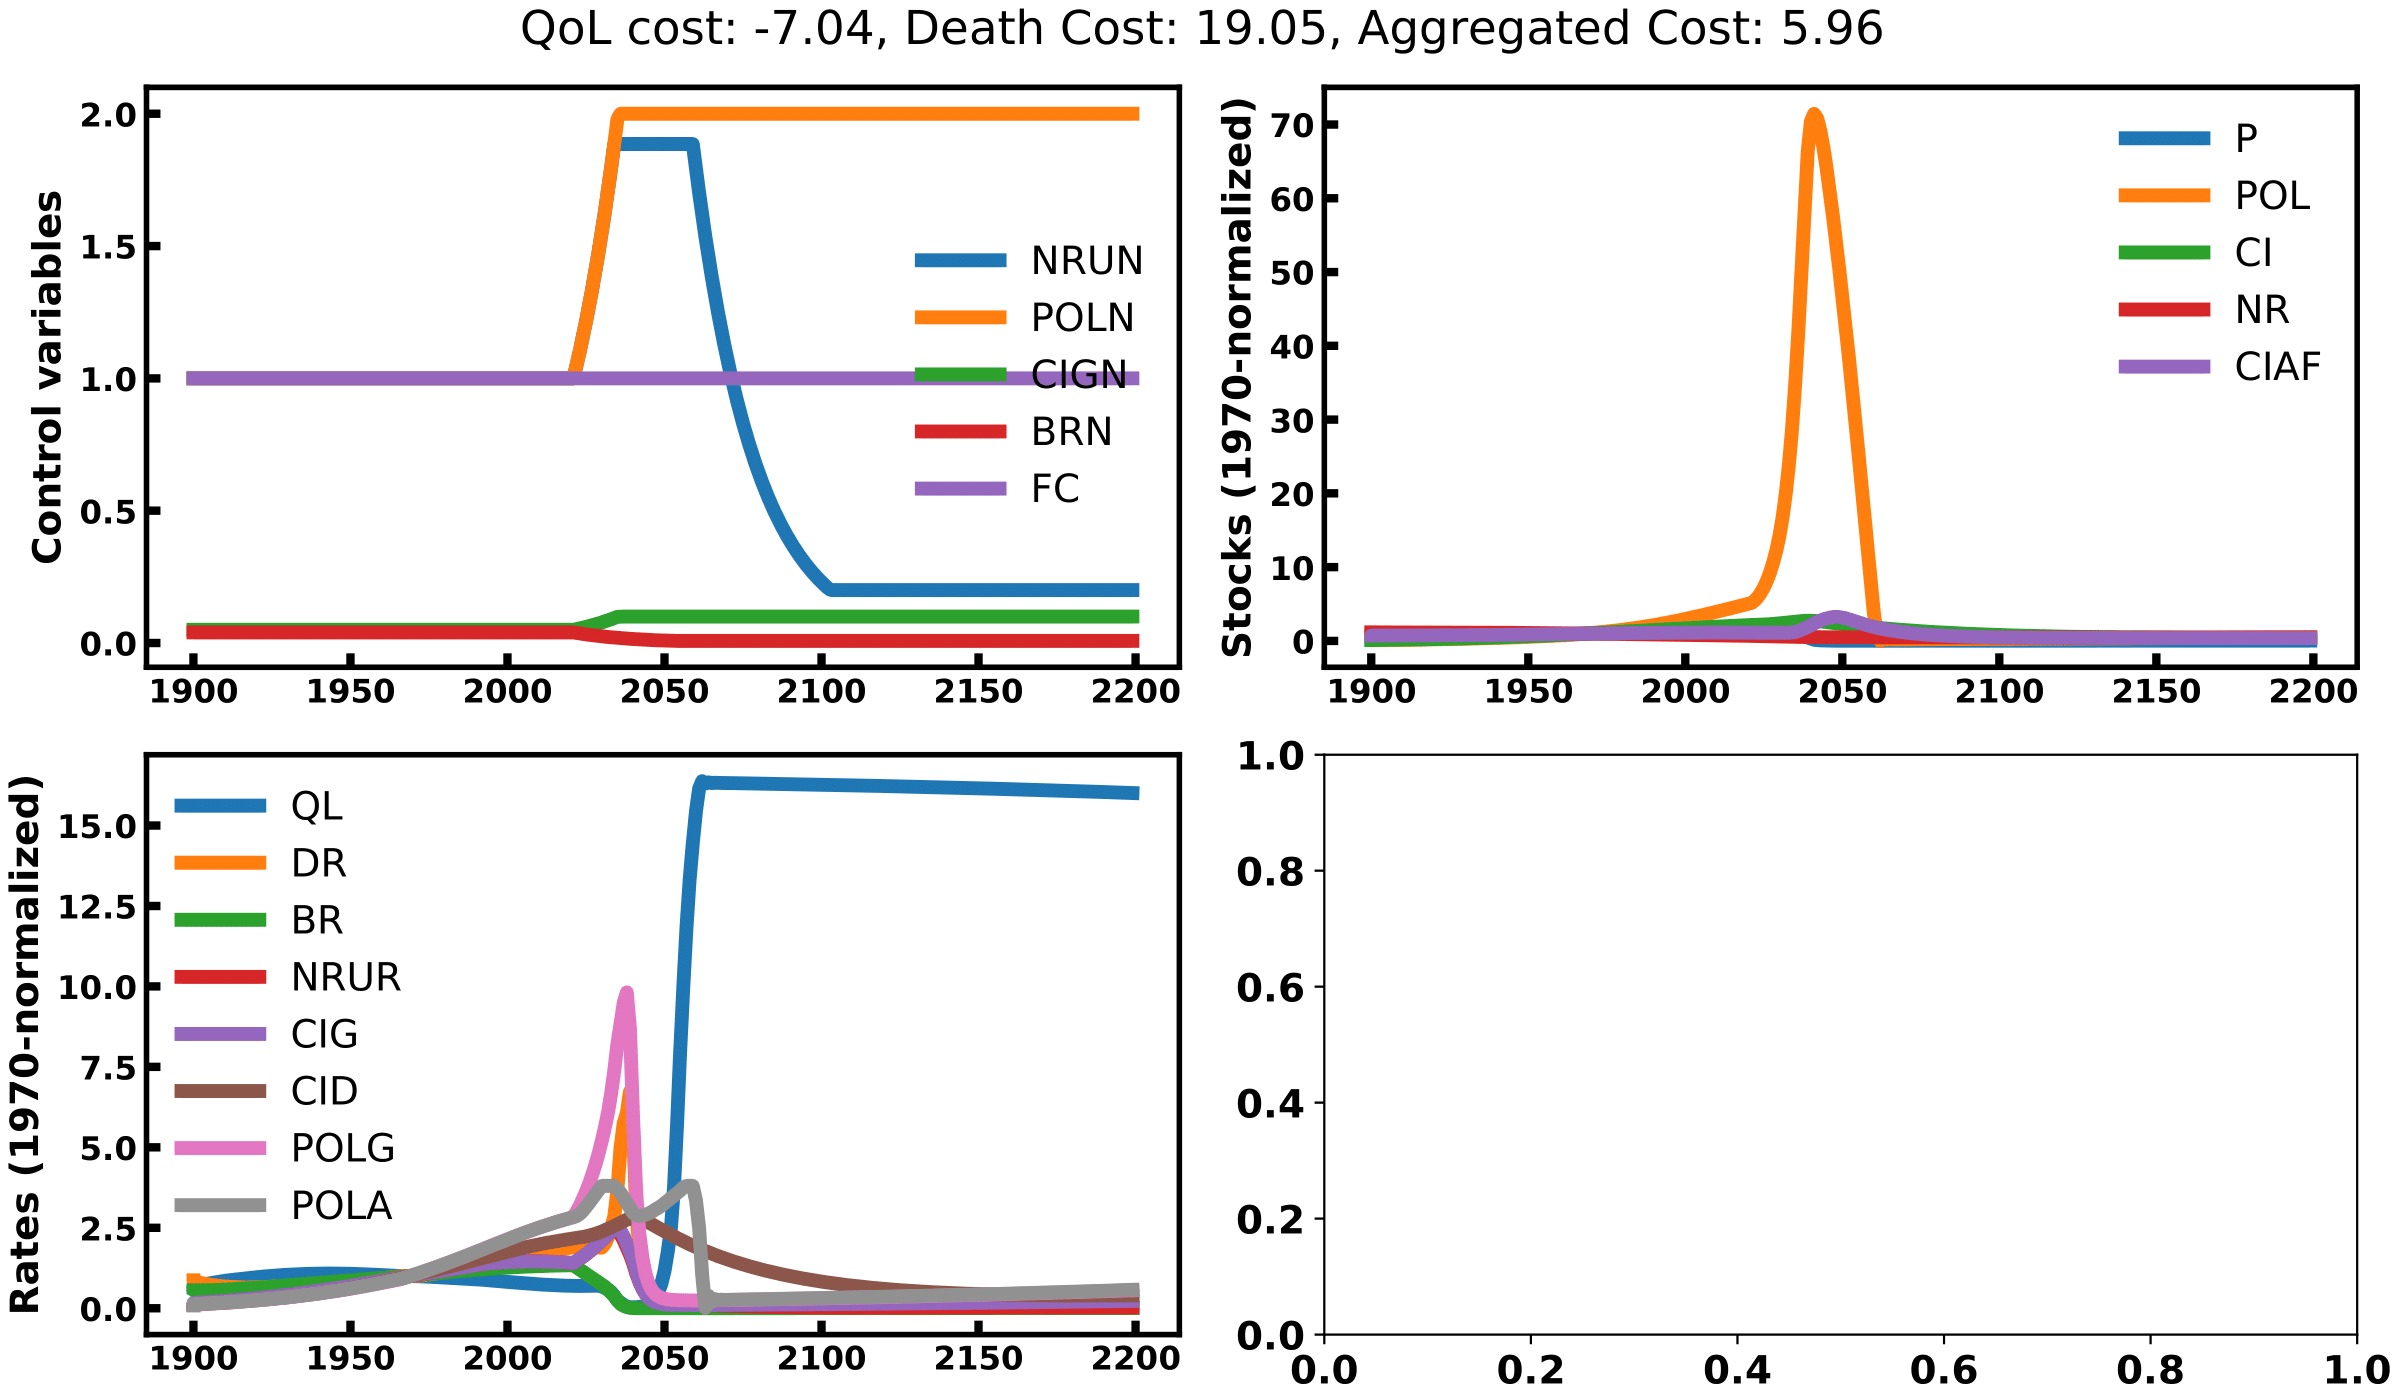
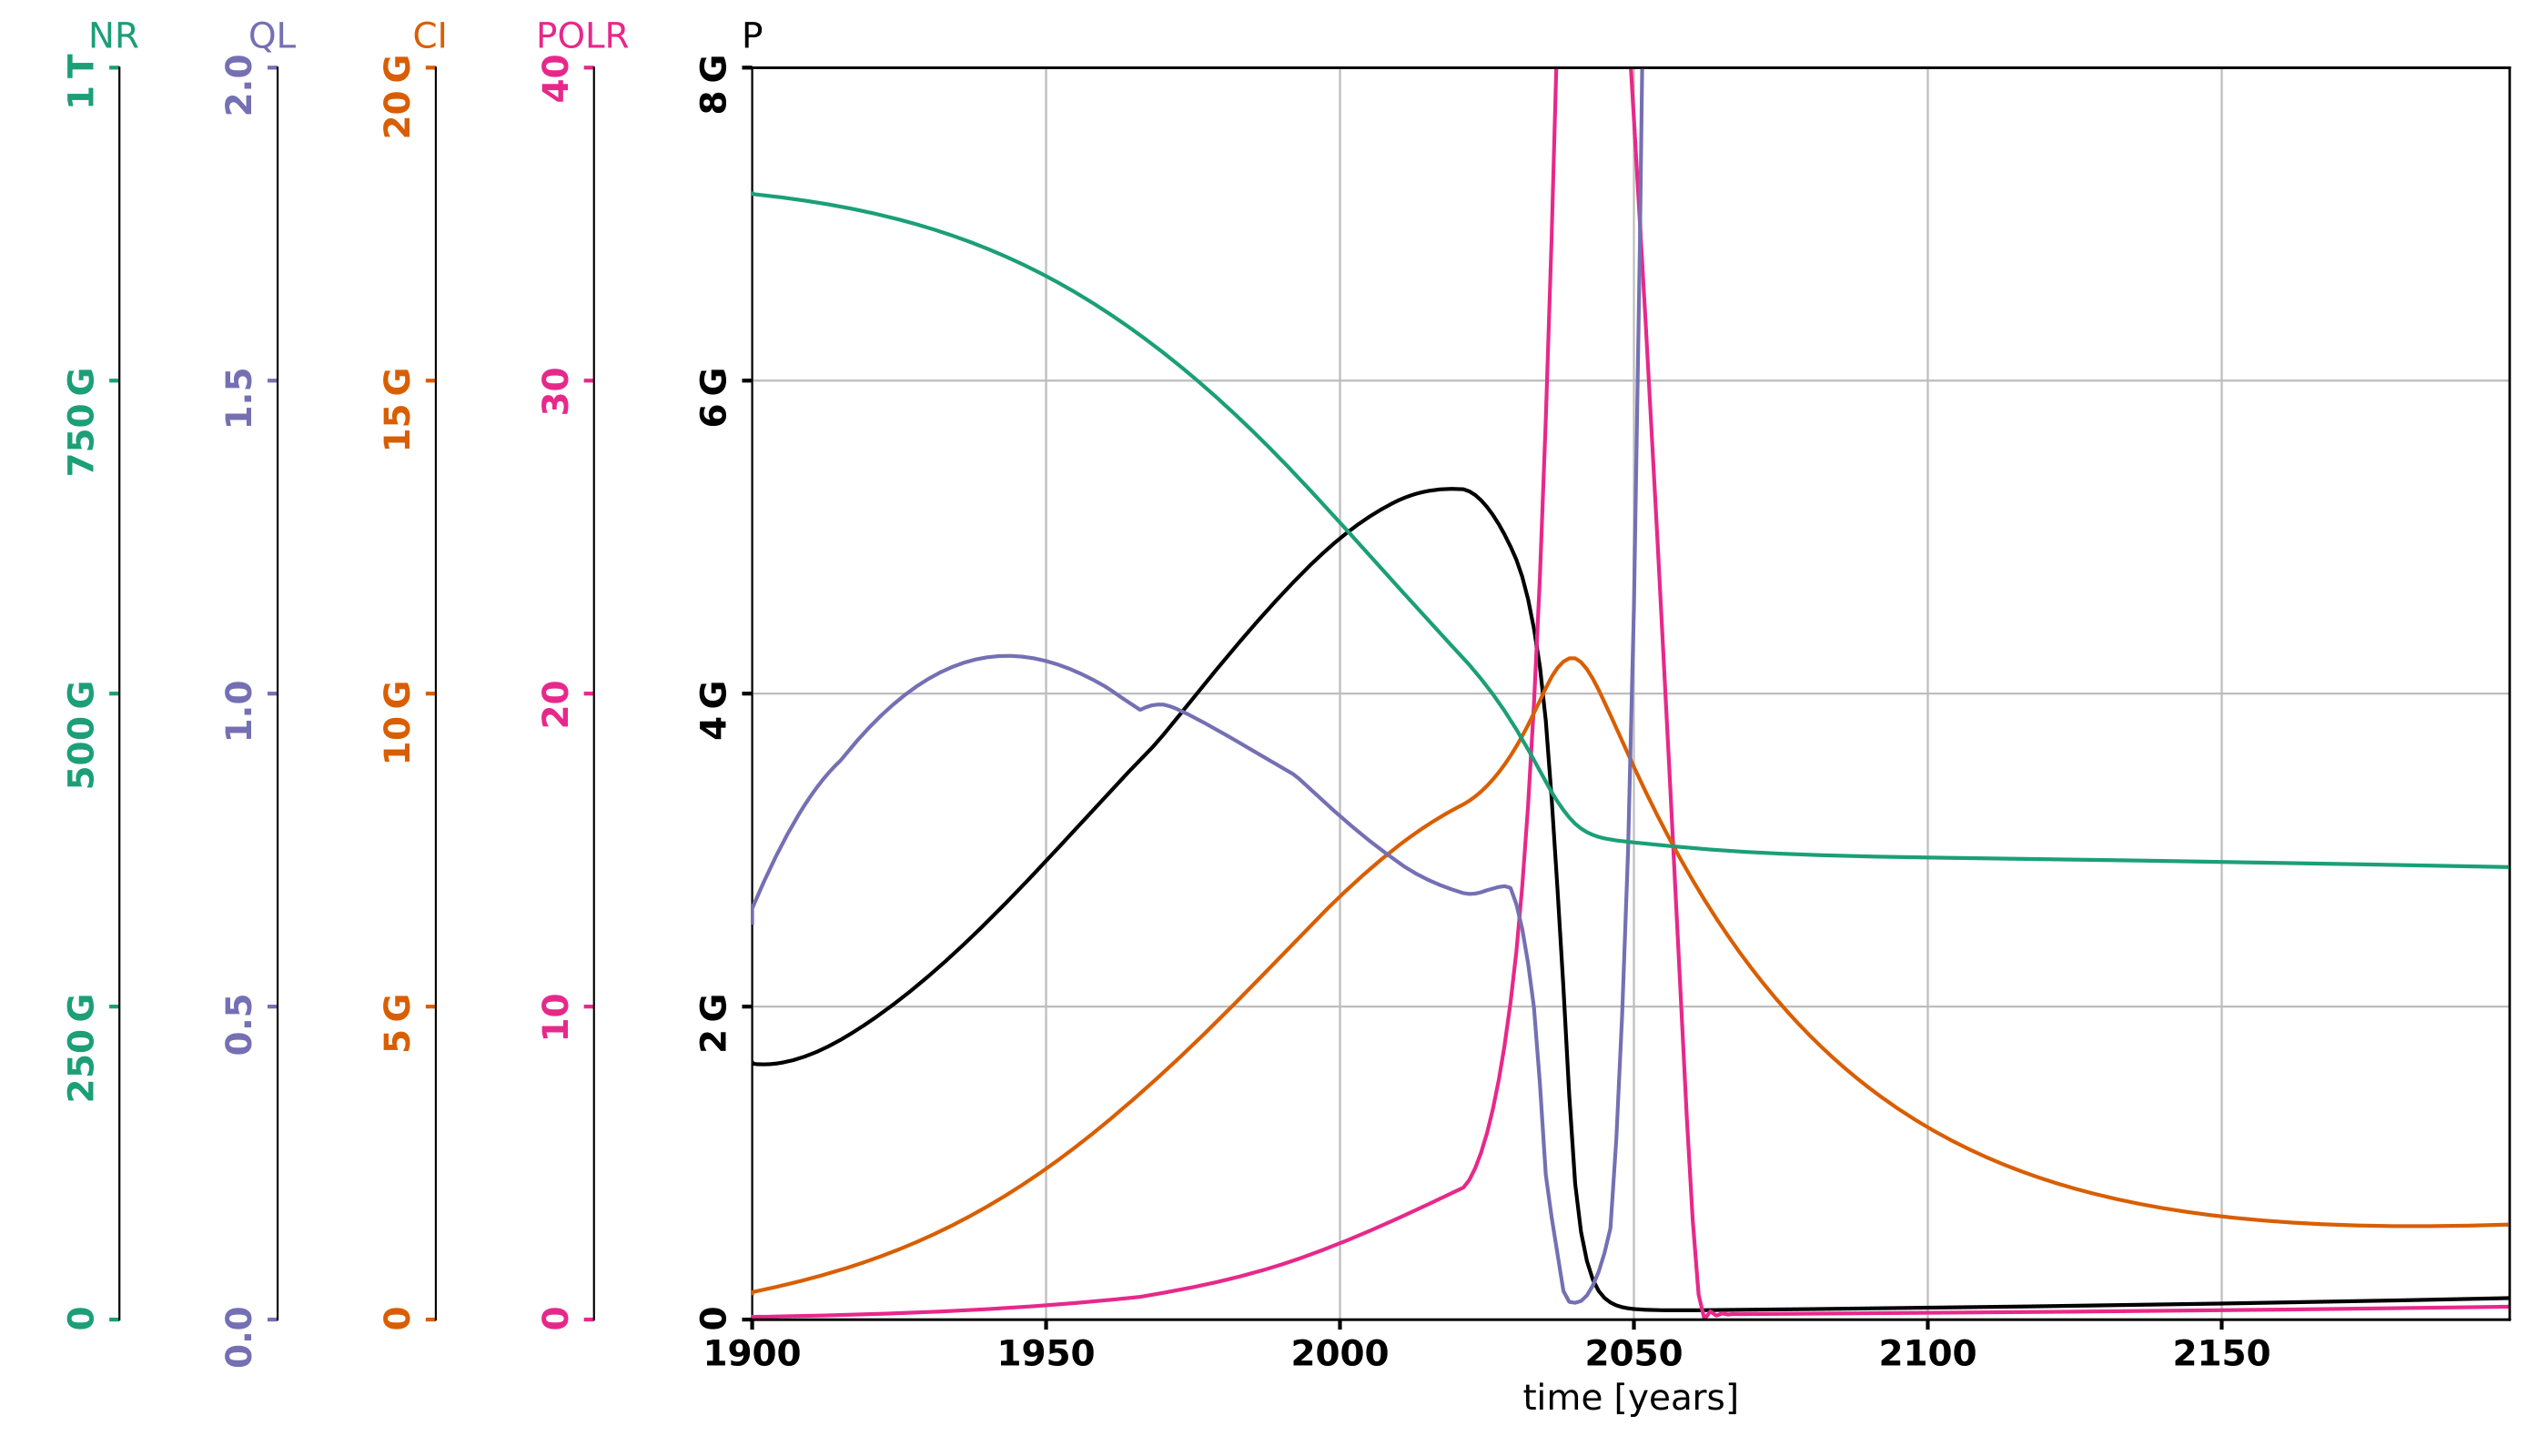
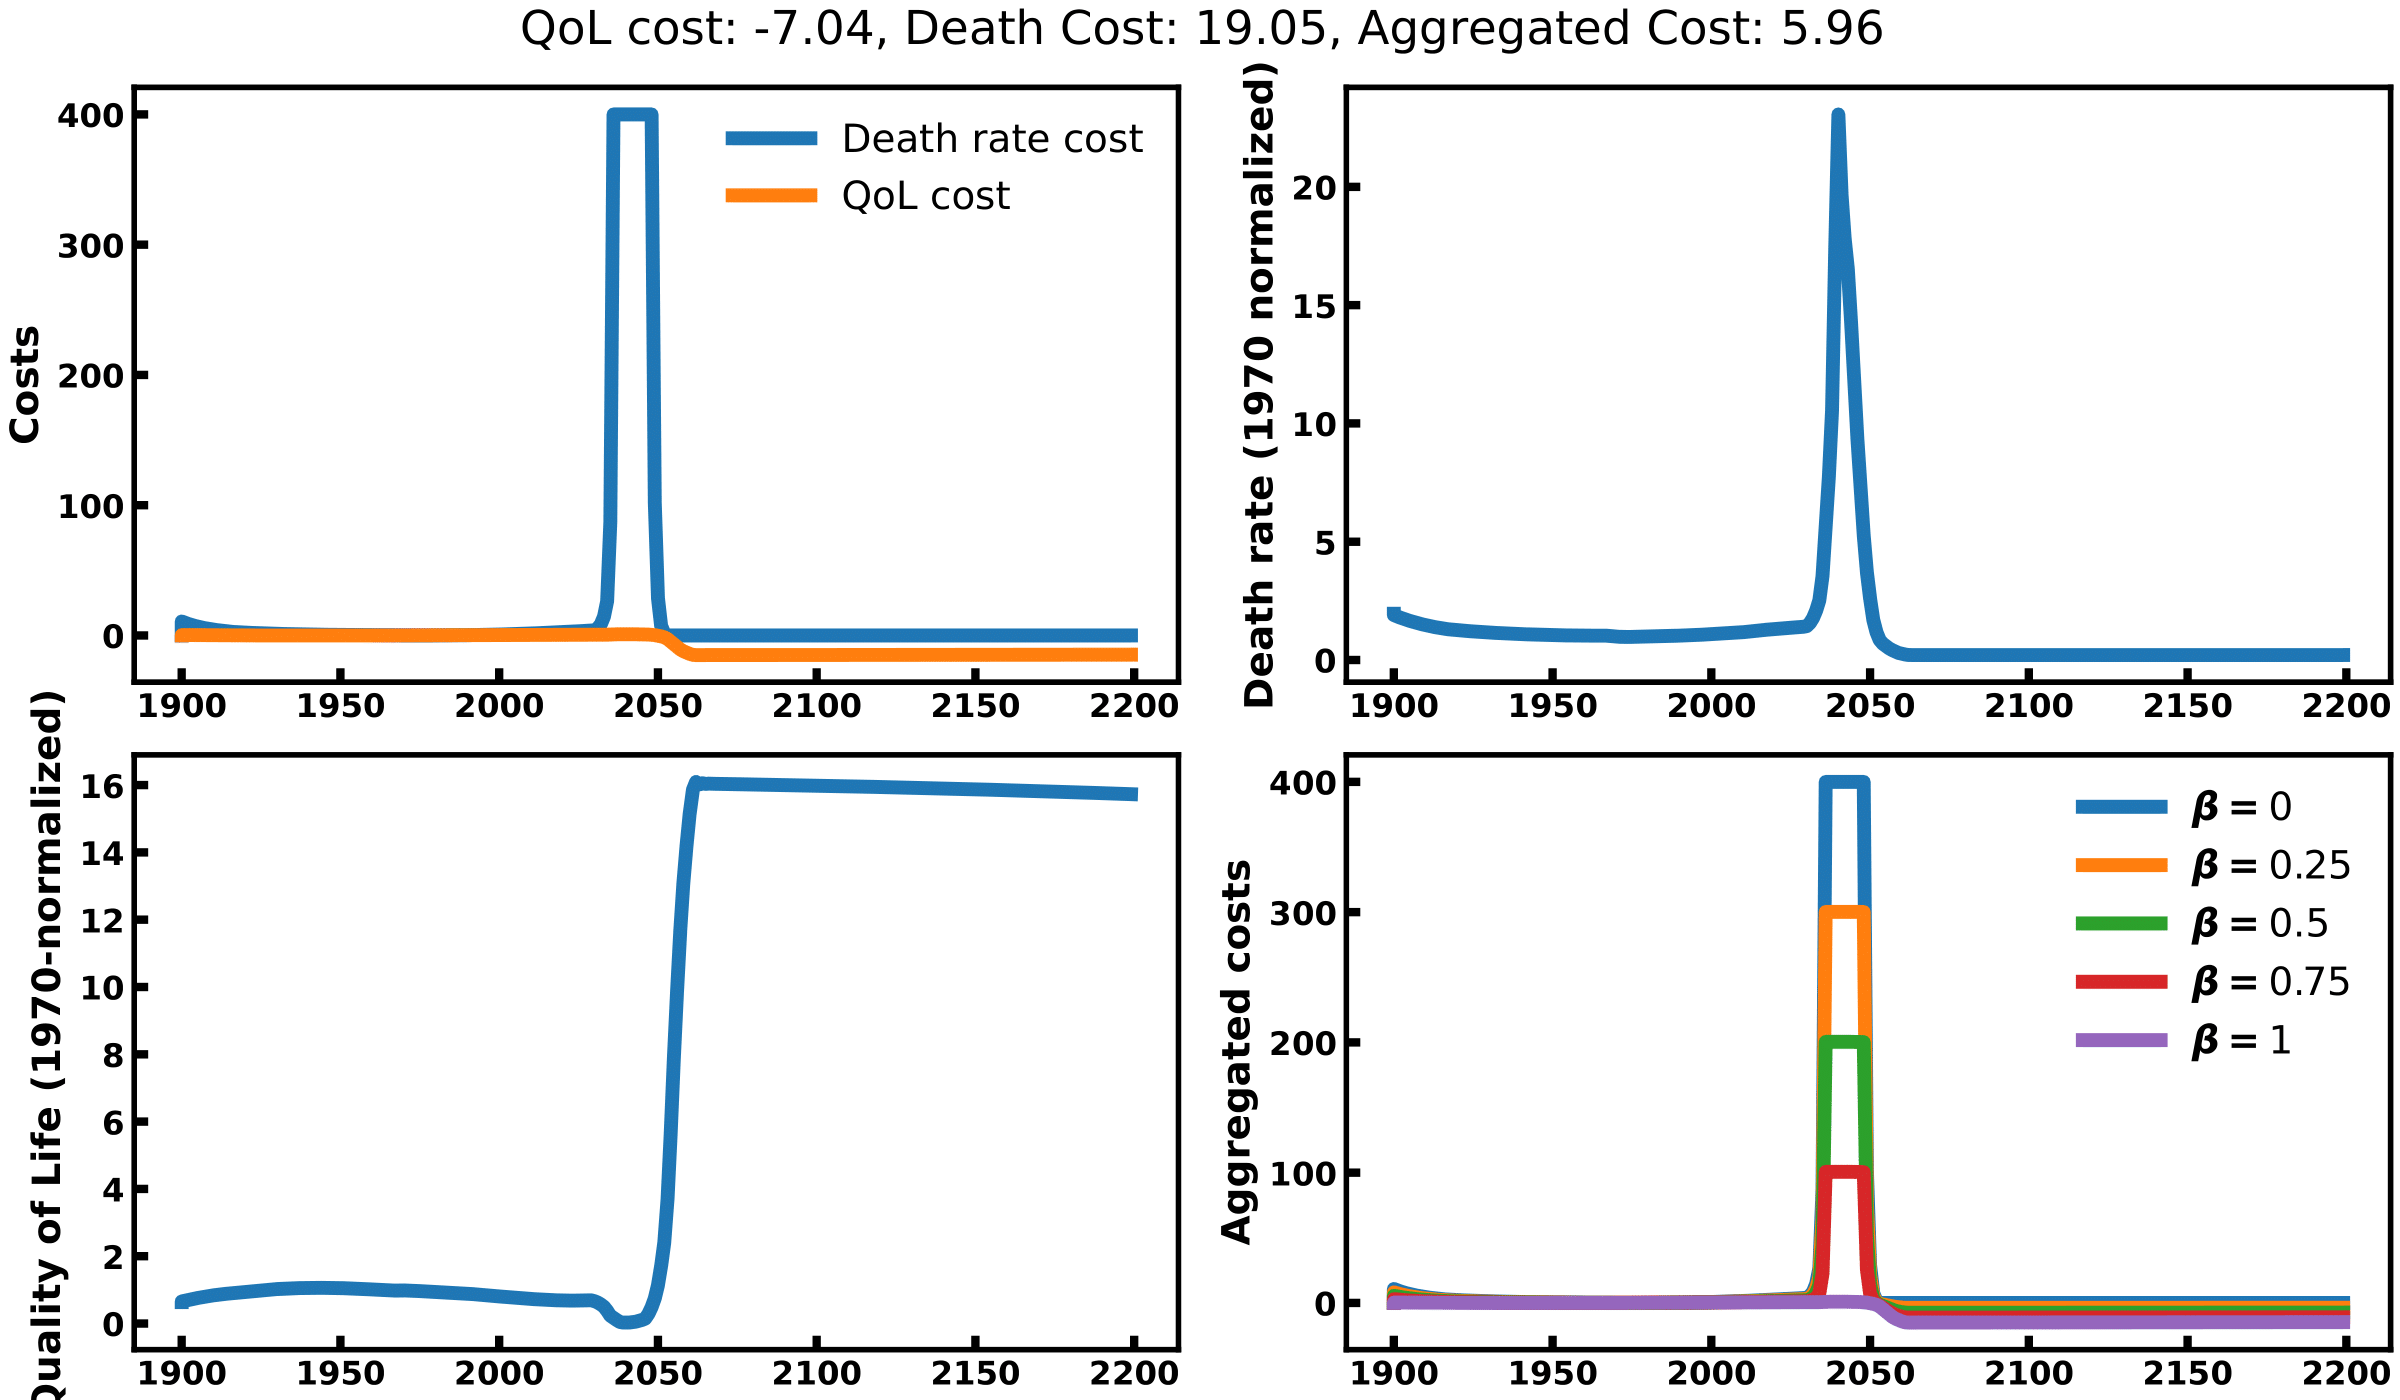
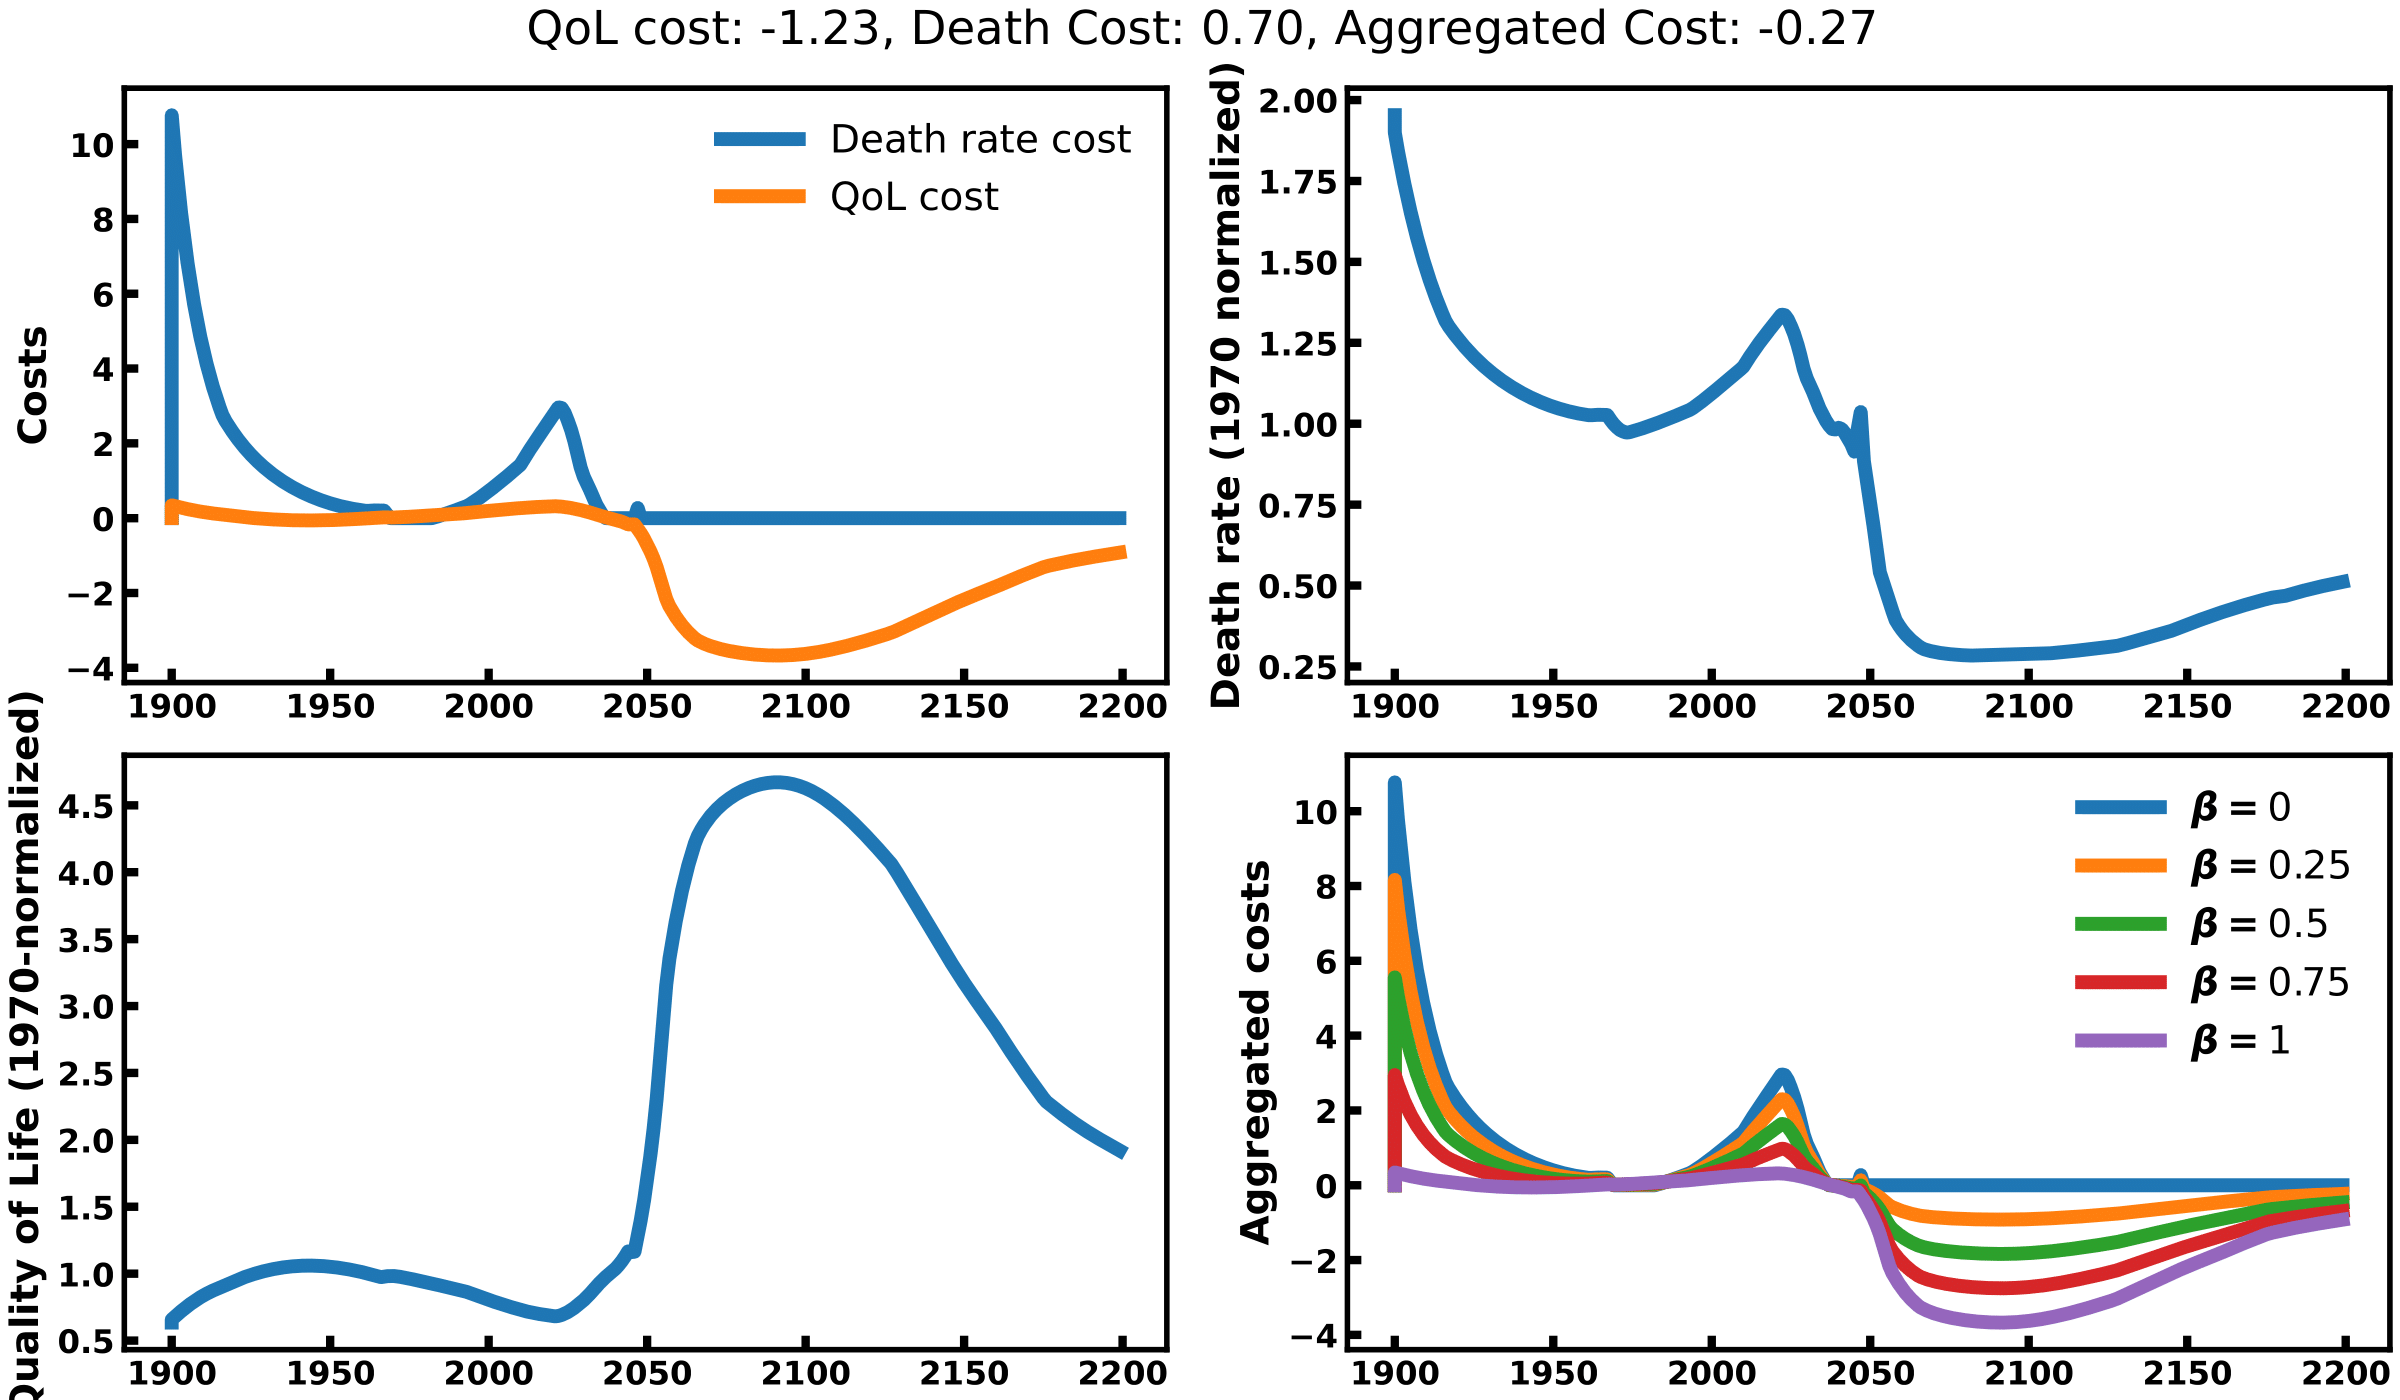
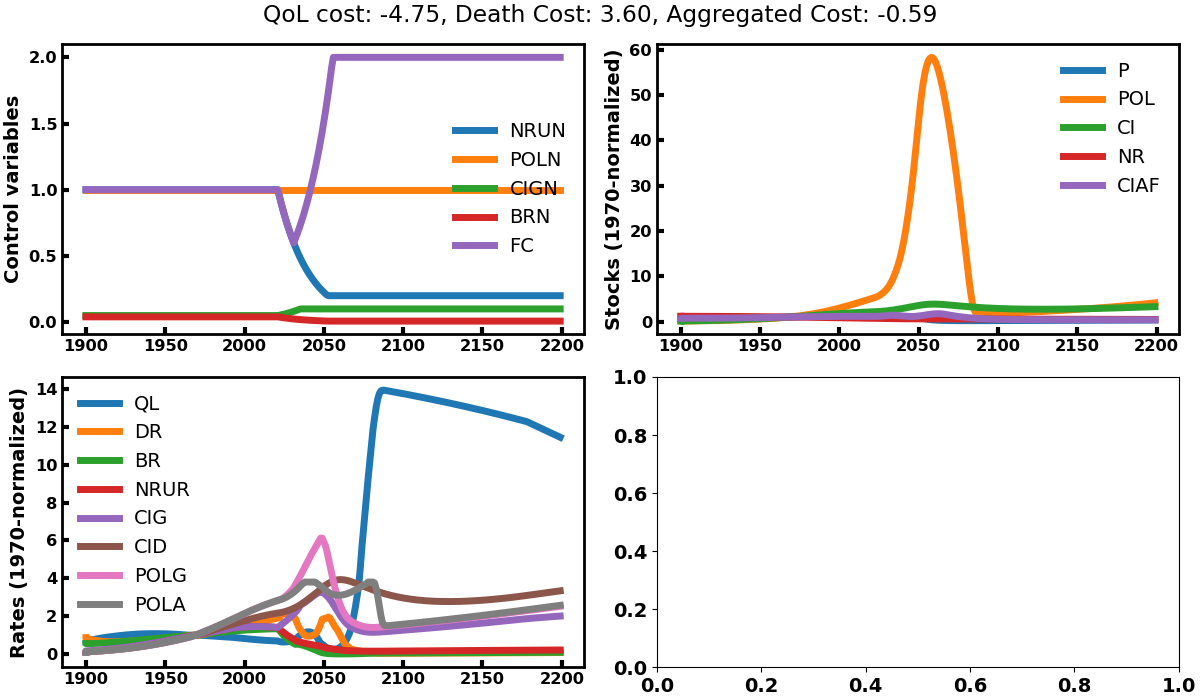
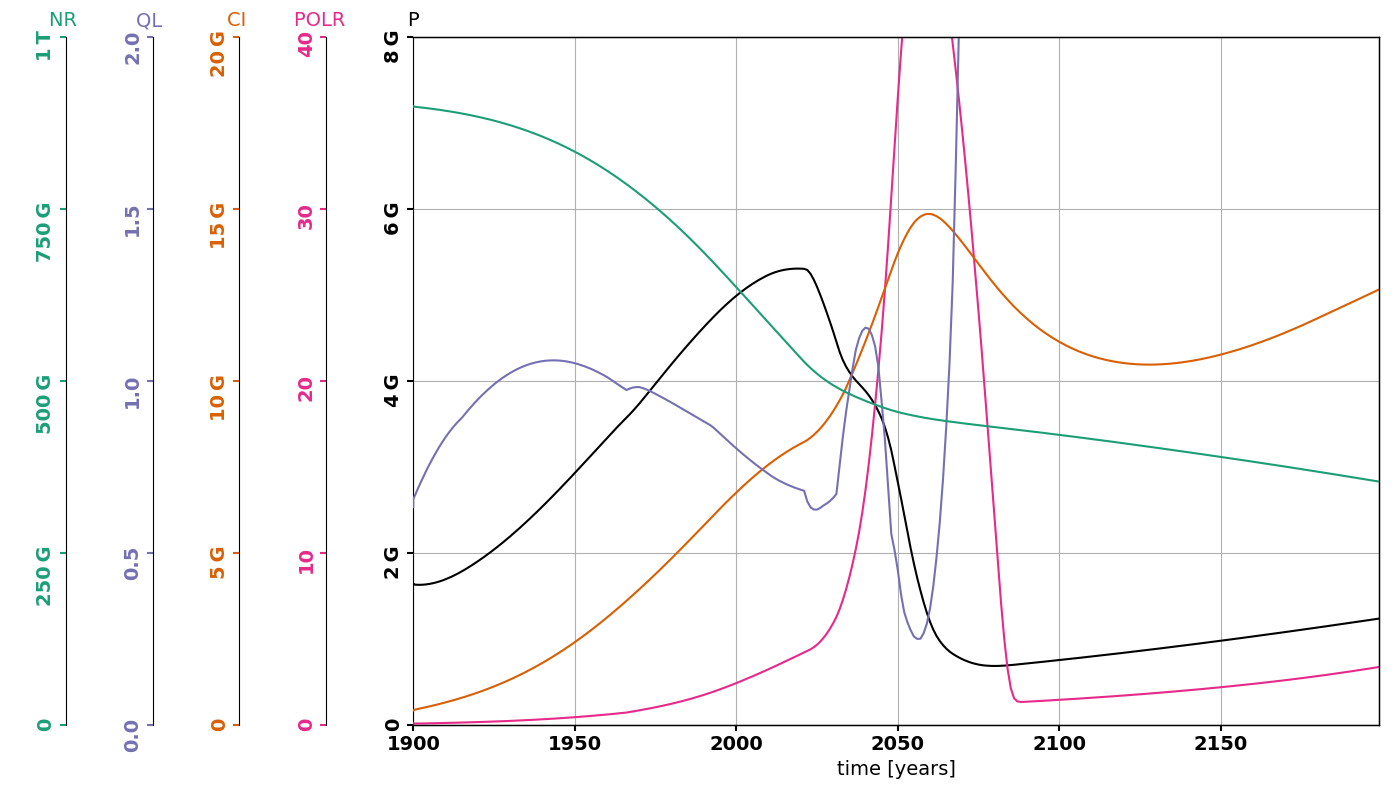
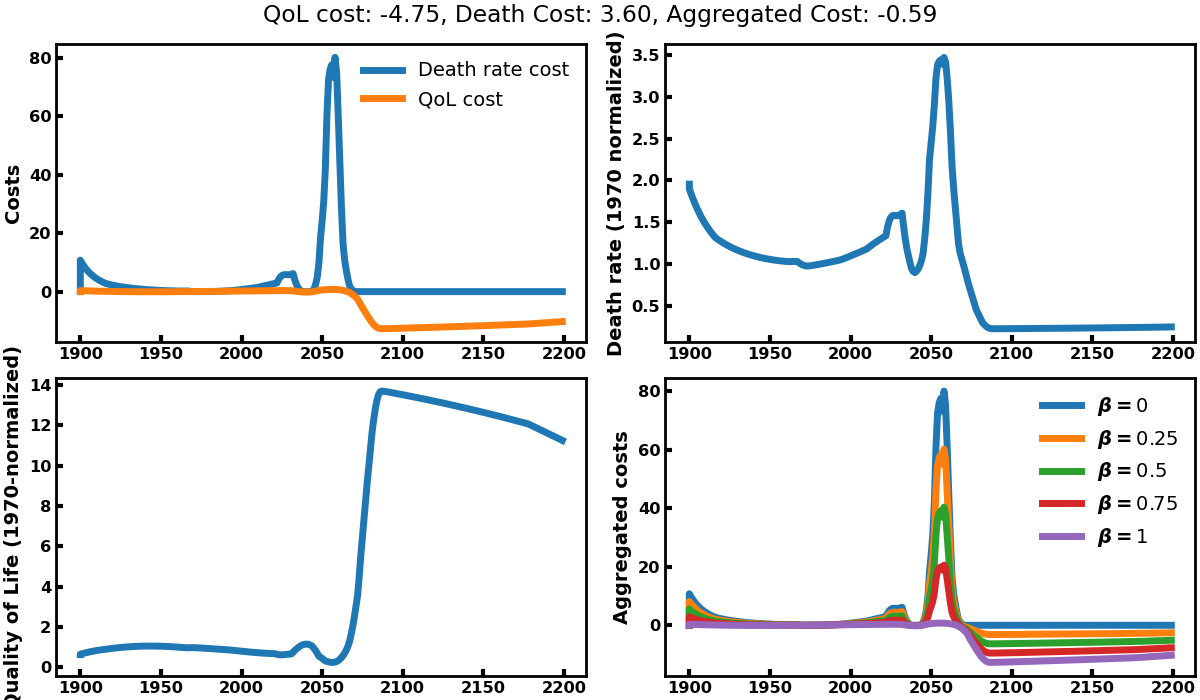
Solution 1 maximizes quality of life while letting death rates aside. To this end, it will do whatever is in its power to kill a maximum of people such that the quality of life of the survivor is maximized. It will increase pollution rates, natural resources consumptions and capital investments while reducing birth rates (see top left graph of image 1). The explosion of pollution leads to a very sharp decline in human population (image 2) and a strong cost linked to death rate (top left graph of image 3). This does not seem like a very popular solution to our problem. Here, we understand that the quality of life metric is computed as a total divided by the number of people alive, which drives the tendency to kill a lot of people so that the remaining can ‘enjoy’ what’s left. This variable must be redefined if we want to use it as an optimization objective.
Solution 2
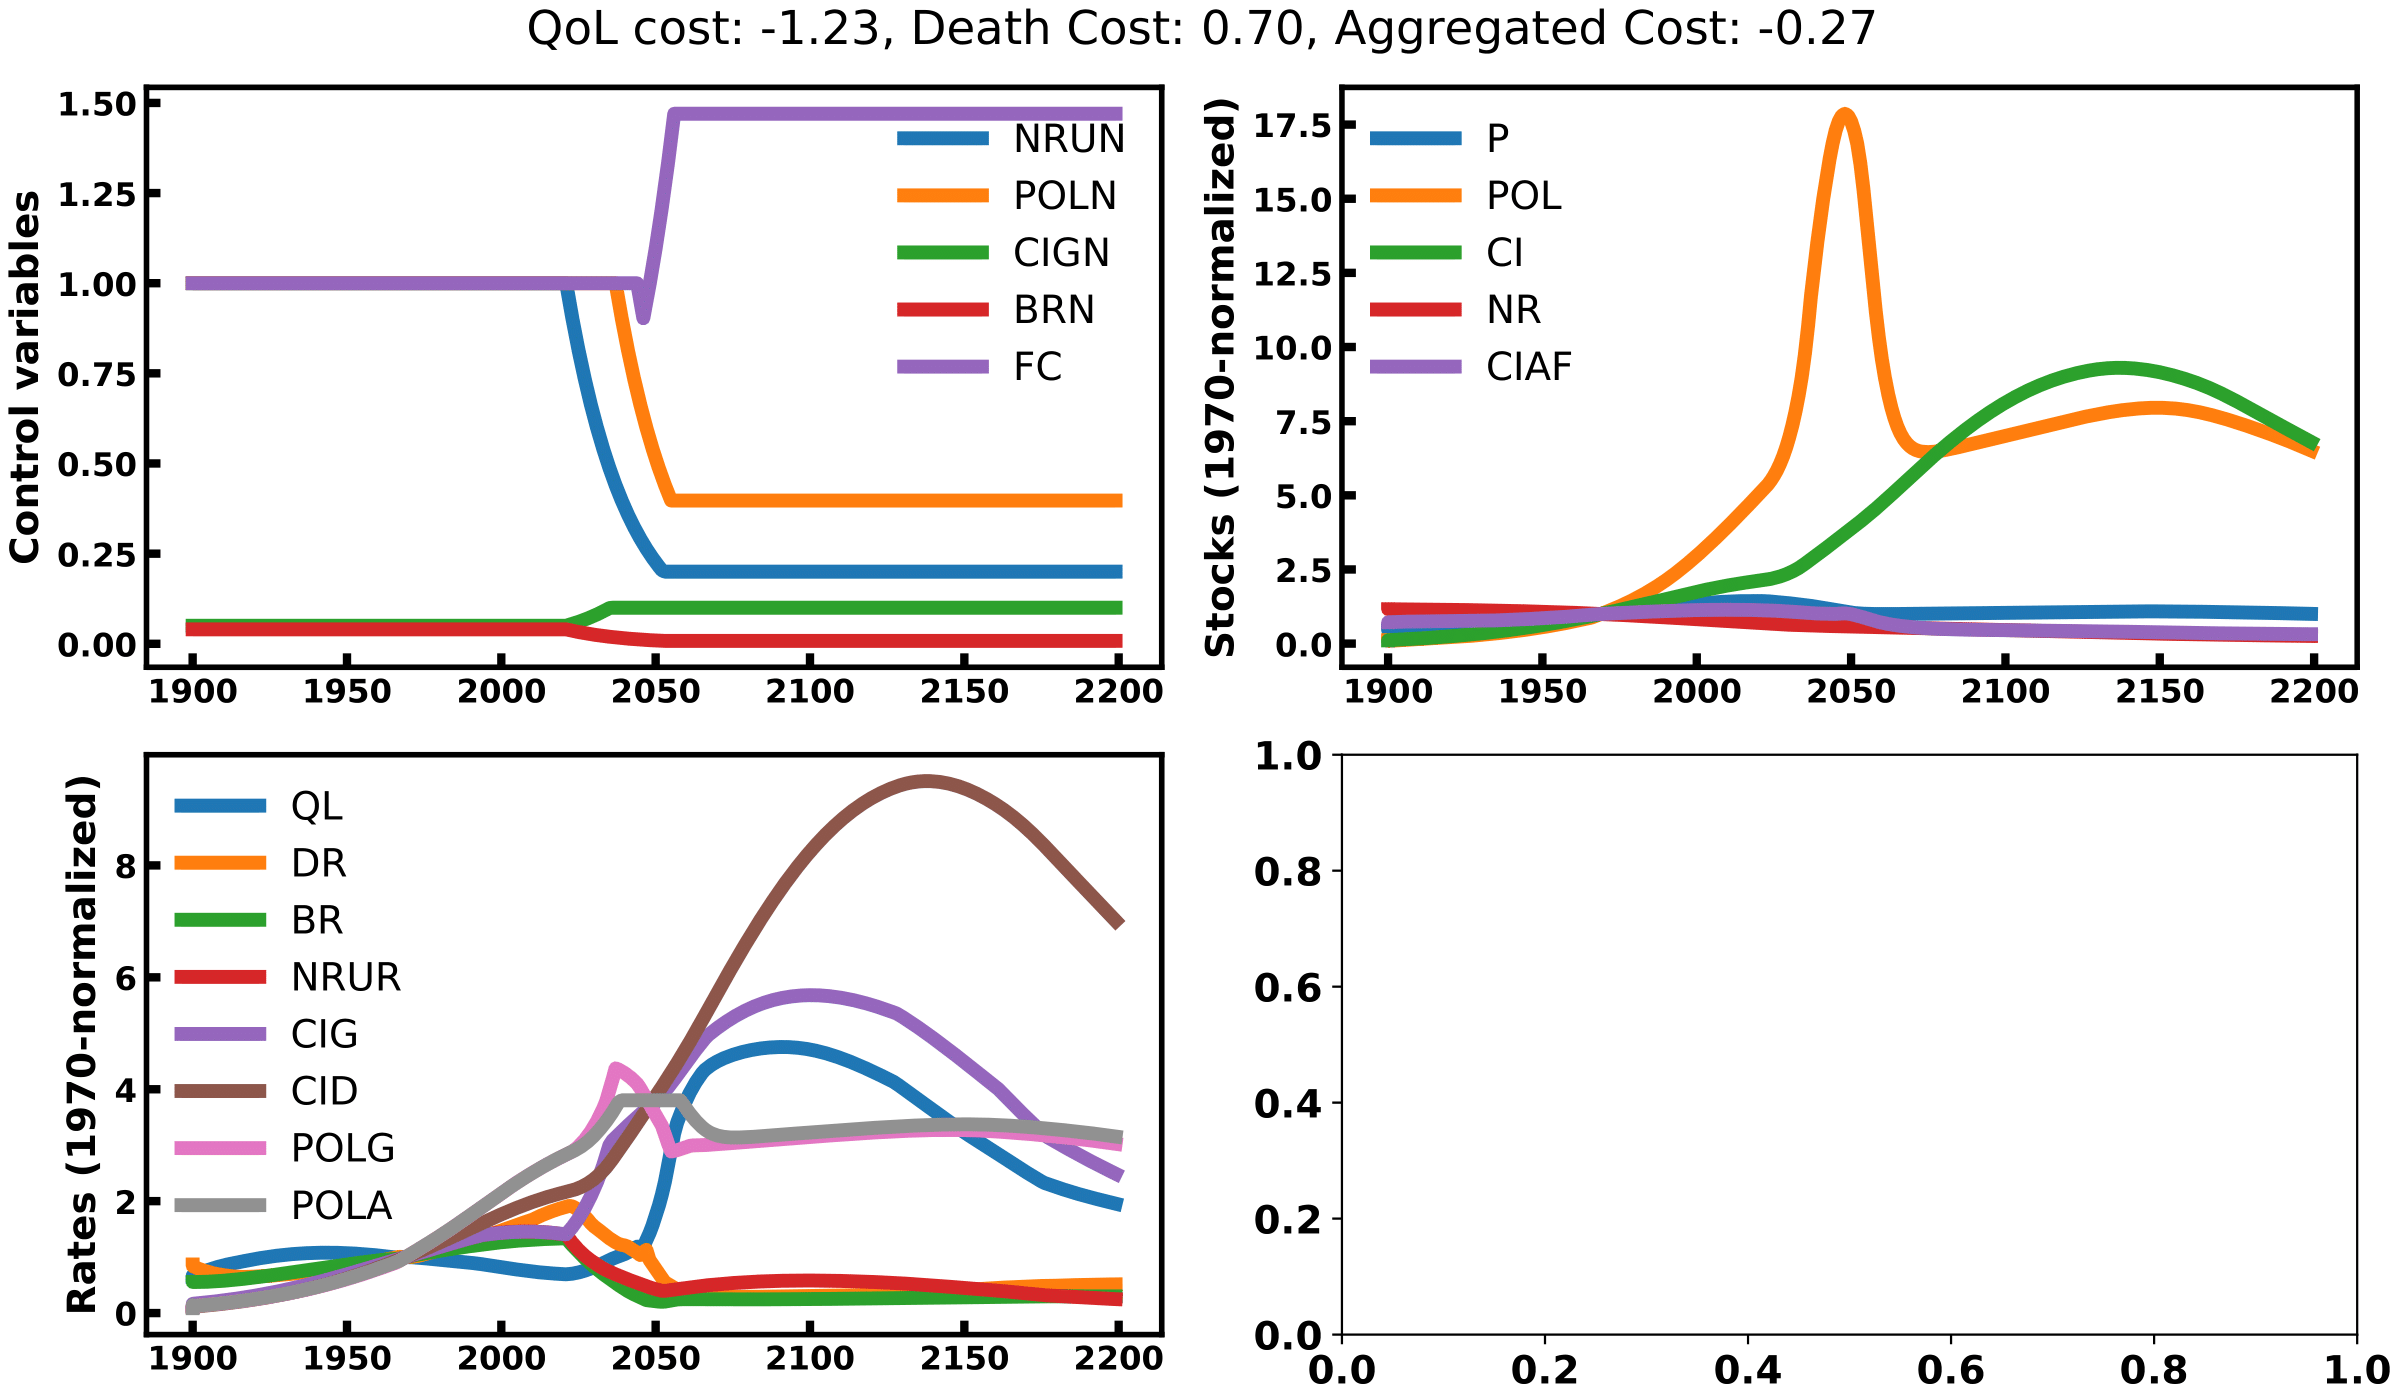
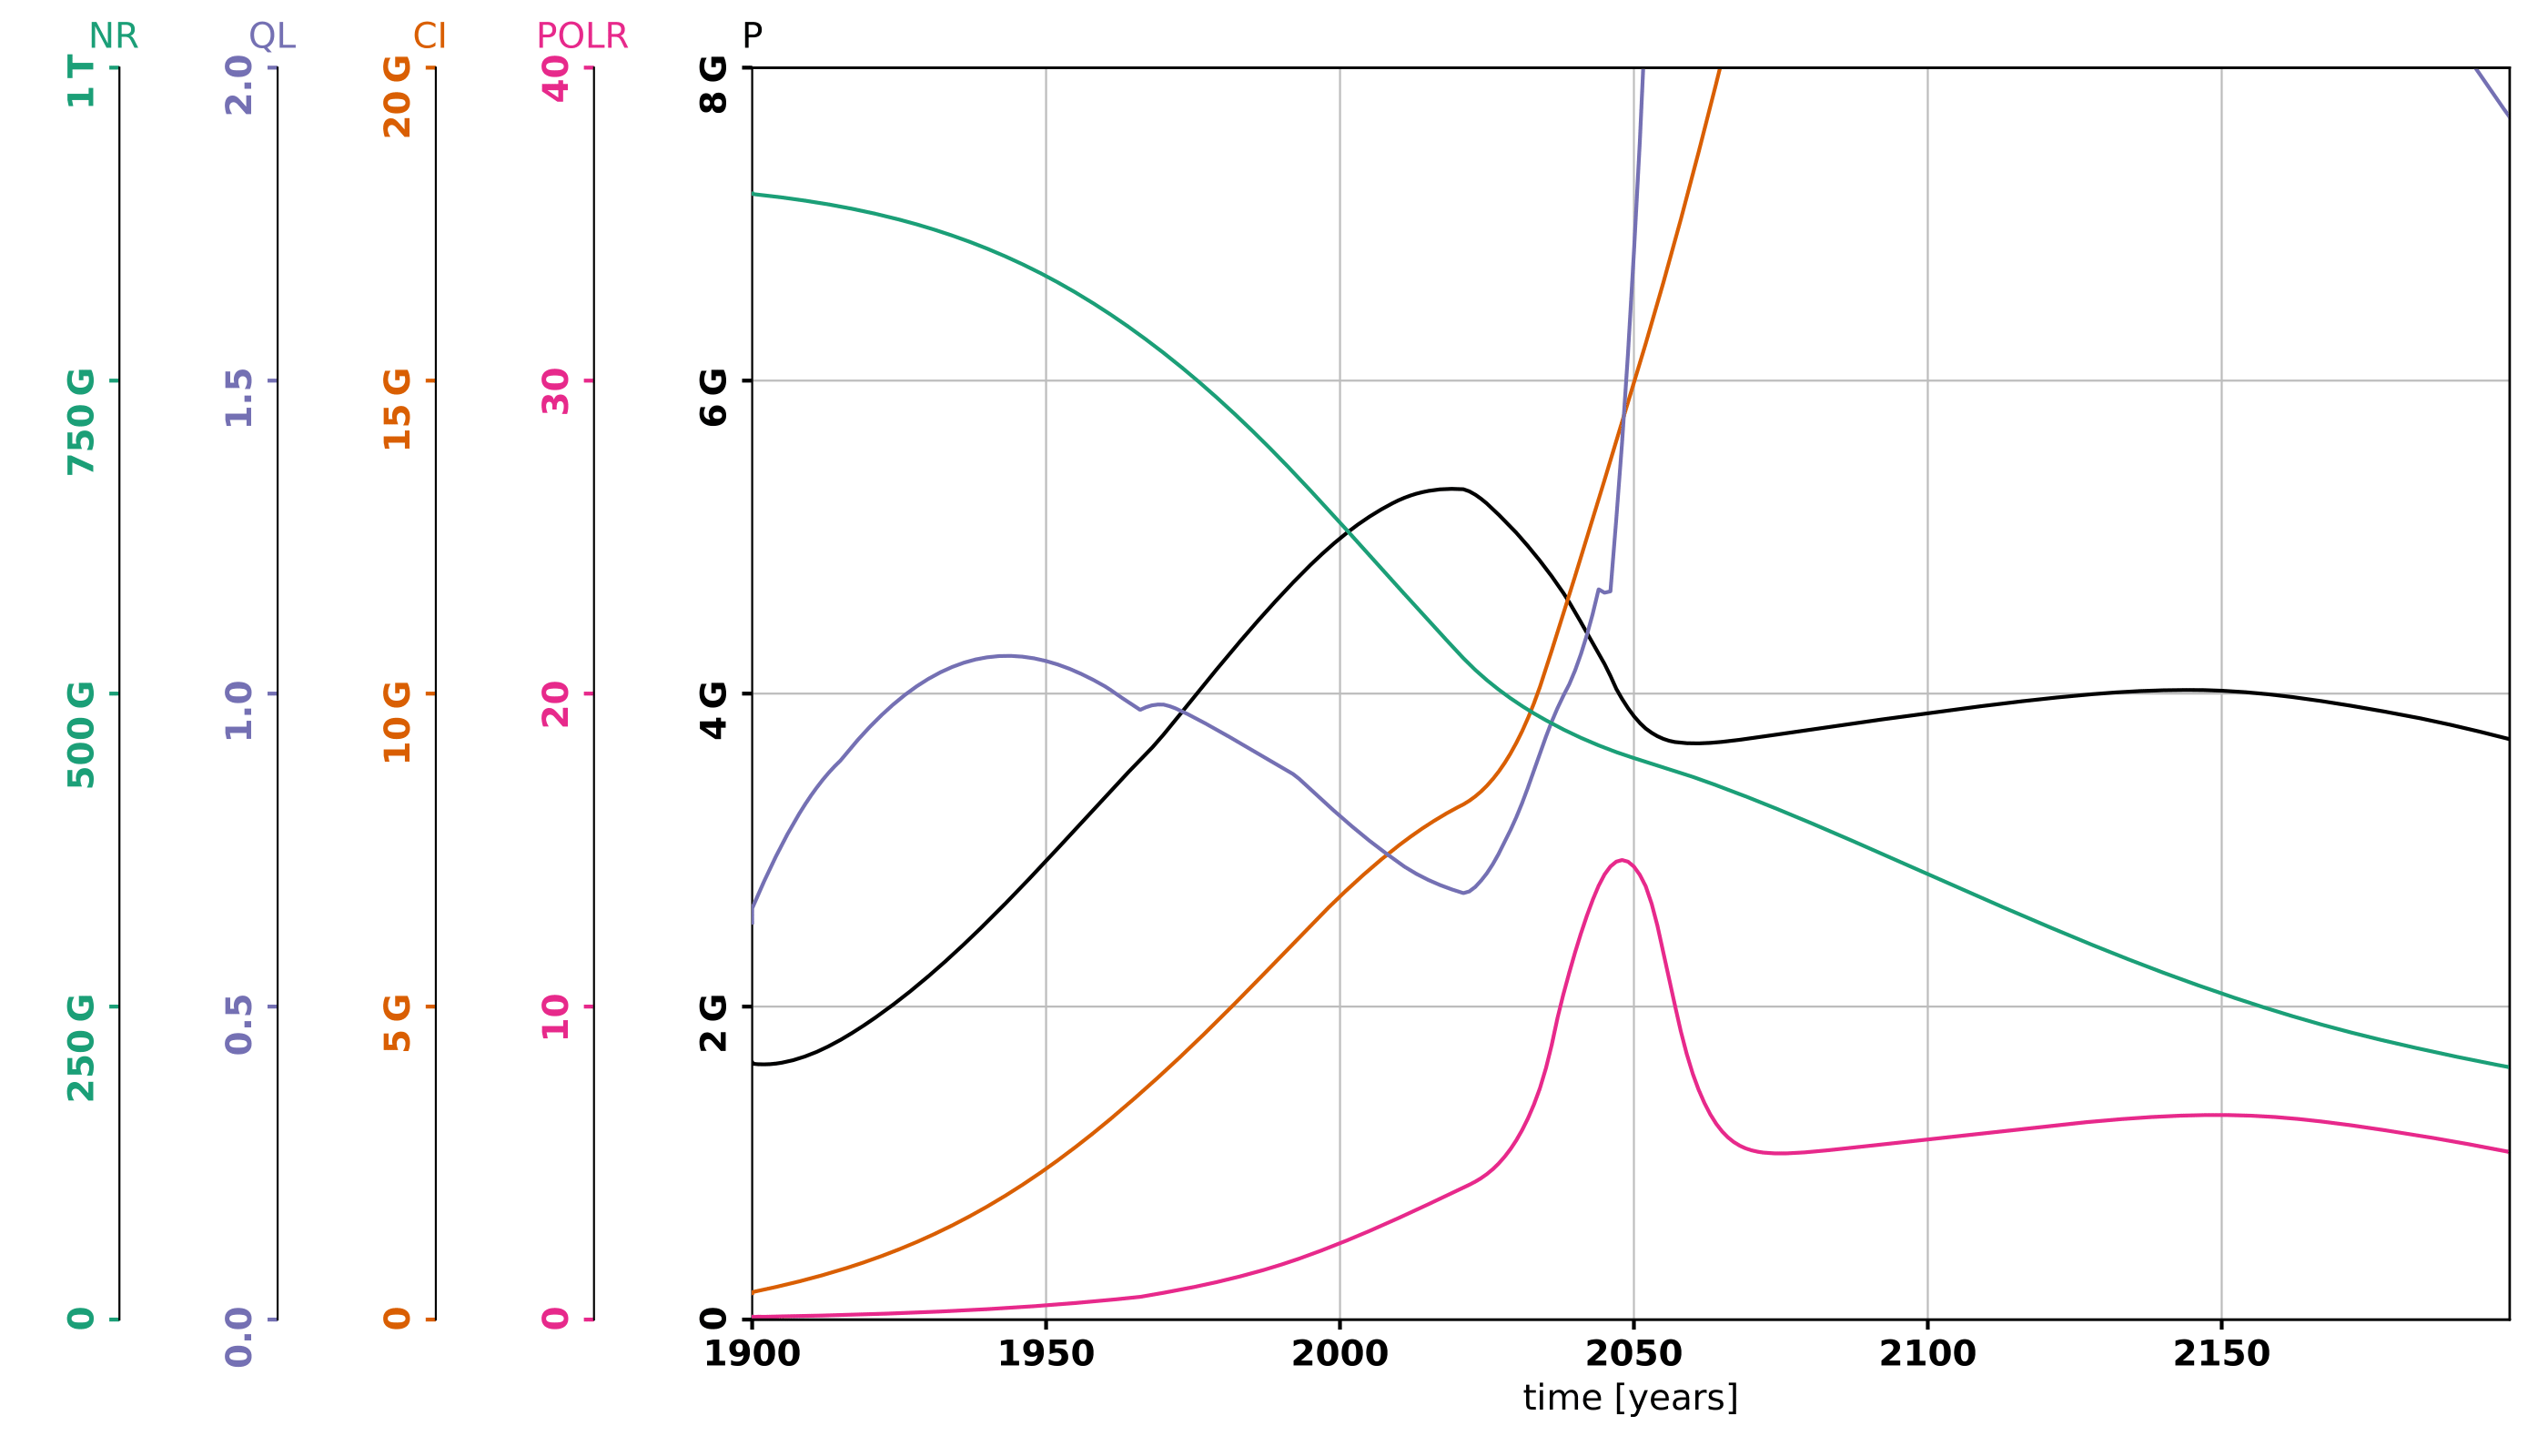
Solution 2 minimizing death rates while letting quality of life aside. To this end, it will strongly act on all control variables by reducing the pollution rate, natural resources use and birth rates and will increase the food coefficient and the capital investment (see top left graph of image 1). This is similar to the best scenario considered in the original book. This scenario still leverages a decrease in population led by the decrease in birth rate, not an increase in death rates. This reduced population lets pollution rates decline and quality of life increase below the level of the ‘business as usual’ scenario. However, the model seems to make two invalid assumptions here. First, it assumes we can easily control birth rates up to 20% of its initial level, which might be hard to implement in practice (see China’s failure on the one-child policy). Second, it bets on our ability to decouple capital investment from the pollution and the consumption of natural resources, a form of green growth. In reality, proofs of the existence of such decoupling remain to be presented.
Solution 3
Solution 3 follows an intermediate strategy between 1 and 2 as it kills a bit more people than 3 but less than 1 so has to trade some death rates against future quality of life.
Conclusion
WorldOptim is an interesting way to explore world dynamics models and potential mitigation strategies. However, it is hard to define meaningful optimization scenarios, because it’s hard to define precisely what we want to optimize for, and what/how mitigations strategies could precisely impact the world model. We’ve seen in the above example that optimizing simple metrics such as the quality of life could lead to diabolic mitigation policies leading to the pure extermination of most humans.
Nonetheless, playing with this framework lets us find flaws in the dynamical models (e.g. the possibility for green growth) and lets us questions our very own definition of what the problem is, what we want to optimize for and how we want to act towards that objective. With further developments and careful design of optimization problems, WorldOptim could become an interesting tool in the analysis of world dynamics model and societal / ecological research.
If you’d like to play with WorldOptim, to refine the definition of optimization problems and to investigate it more, feel free to check out the code. You can reach me by email to discuss such projects.